Building a dashboard
Asking for charts in a chat, watching them land on the canvas, and saving the result as a dashboard.
Overview
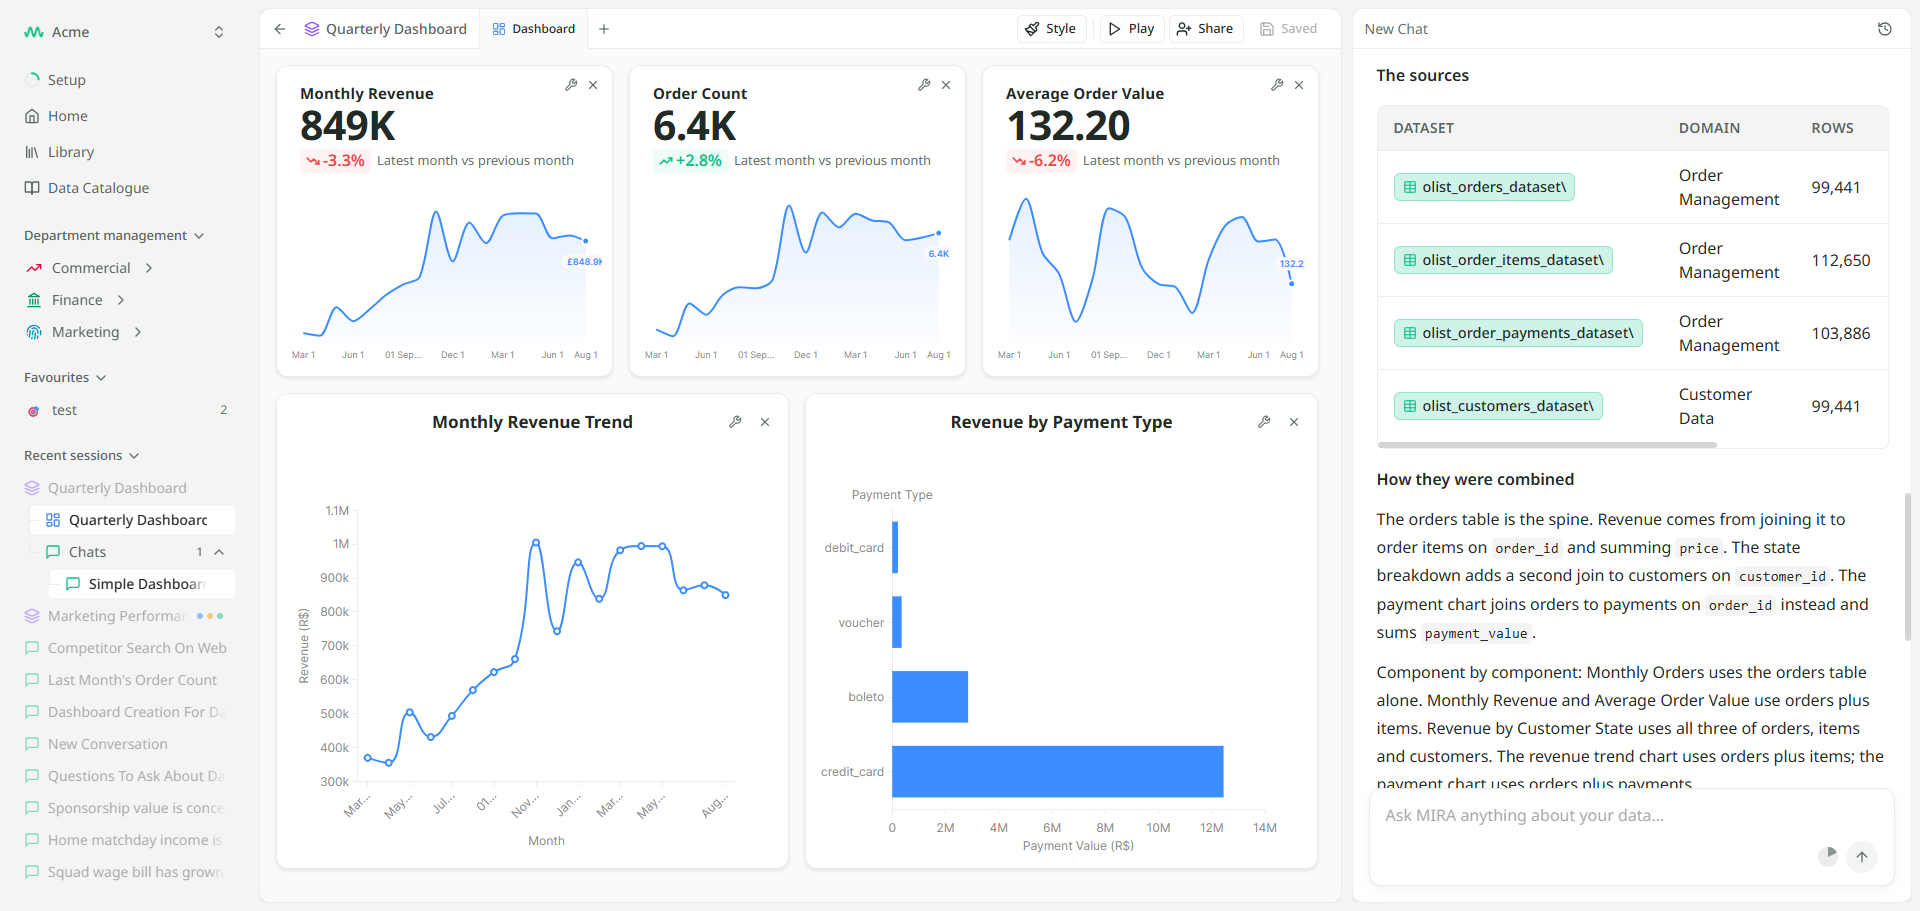
A dashboard is a set of charts and figures on one page, kept up to date. You do not build it in a separate tool. You ask for charts in a chat, and each one Mira makes goes onto the canvas beside it. Save the canvas and it becomes a dashboard you can find again, share, and present.
Every session holds at most one dashboard, so the canvas you see in a session is that session's dashboard. See Chats and sessions.
Getting a chart onto the canvas
Ask for one. "Chart web store revenue by month this year" gets you a chart. "What is gross margin this quarter, as a figure" gets you a figure. Mira looks the answer up in your tables, draws it, and places it on the canvas. The first chart opens the canvas on the left; the next ones find a free space beneath or beside it.
You can ask for a whole dashboard at once. The Build a dashboard suggested start on the home screen asks Mira for your most important measures as charts, and they all arrive together. Asking questions covers the suggested starts.
Each chart on the canvas is also an answer, with the tables it used and the working behind it. Reading an answer shows where to look.
Saving and naming
Until you save, the button at the top right of the canvas reads Unsaved. Everything on the canvas is still there, but only in this session.
- Click Unsaved at the top right. You need at least one chart on the canvas.
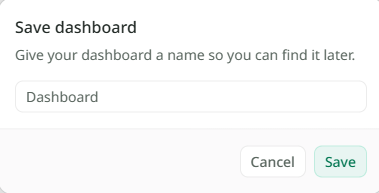
- The Save dashboard window asks for a name. Choose one that says what it is for, such as "Wholesale weekly". It needs at least three characters.
- Click Save. The button changes to Saved, and the dashboard appears in your sidebar and the Library.
Once a dashboard is saved, you do not need to save it again. Changes to the canvas save on their own, and the button shows Saving... and then Saved as they do. You can rename the dashboard from the Library.
What happens next
A saved dashboard remembers the questions behind its charts, not the numbers. Open it next week and the charts show next week's figures. Always current explains. To move, resize or remove what is on the canvas, see Editing the canvas.